Debugger
Brief
Are you tired of printing values to the terminal to know what is going on? Is your program crashing and you don't know where or why? Well the debugger has got your back!
A debugger allows you to stop the execution of your program once it reaches a specific point, called a breakpoint, or once a crash occurs. Once hit, you are able to inspect the value of all the variables (and the whole program memory). You can also see which functions were called until this point through the callstack. Finally, you will be able to advance step-by-step into the execution.
How to (with VSCode)
Prerequisites
You need to use
cpptools-extension-pack and have a C++ compiler installed on your computer.Run your debugger
Simply use the "Run and Debug" button in the bottom bar:
![]()
Set breakpoints
You can set a breakpoint by clicking on the left of the line, right before the line number, or by pressing F9.
![]()
Then, when you run your code with the debugger the program will pause when it hits a breakpoint and the editor will jump to the breakpoint which was hit. You can even place conditional breakpoints if you right-click on the red dot and select "Edit Breakpoint...". Great if you want the execution to stop only if a variable has a specific value.
Inspect the state of your program
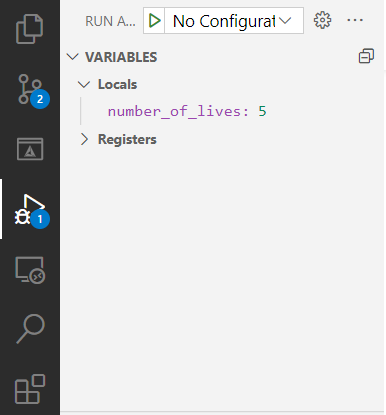
Once your program paused on a breakpoint or a crash you can see the value of all variables (by hovering over them or looking in the variables window):
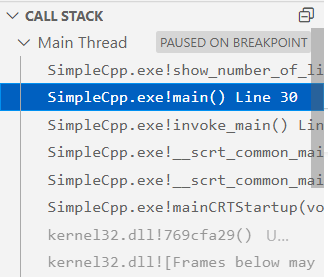
You can also see all the functions that have been called previously (called the call stack) and jump to them:
Finally you can execute the program step by step with the second arrow (step over) or the third one (step into):

Configure your debugger
If you are using the template project this is already done for you! And if you are using the
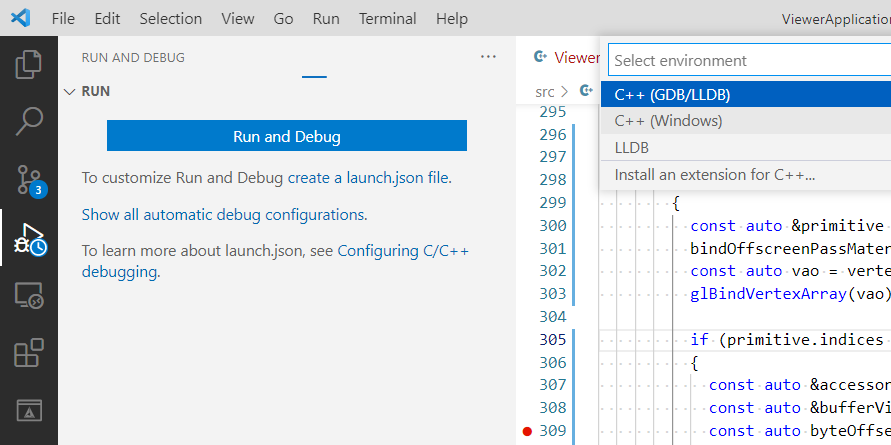
cmake-tools extension you don't even need thislaunch.json config file.Yet you might want to set this up by yourself in the future. In order to do so, simply open the "Run and Debug" panel and click on the "Run and Debug" blue button. You now have to select your debugger, first option is for Linux, second is for Windows. Press Default Configuration and it will create a launch.json file under the .vscode folder.
If you want to know the specific details, doc is here. For now you only have to set the "program" field with the path to your executable (so you have to build your program with F7 beforehand). In general with the CMake setup it will be under ${workspaceFolder}/build/bin/Debug/YOURPROGRAM.exe but you should check to be sure.